 GridNMS
GridNMS
GridNMS unifies every device, log, and metric on one living graph — so when something breaks, you see the cause and everything it affects, not a wall of disconnected alerts.
From $99/month. Cloud-hosted, or self-hosted with Docker.
Five modules. One graph. No integration project.
Monitoring, topology, logs, detection, and collection are one product that shares a single model of your network — not a stack of tools you wire together and hope stays in sync.
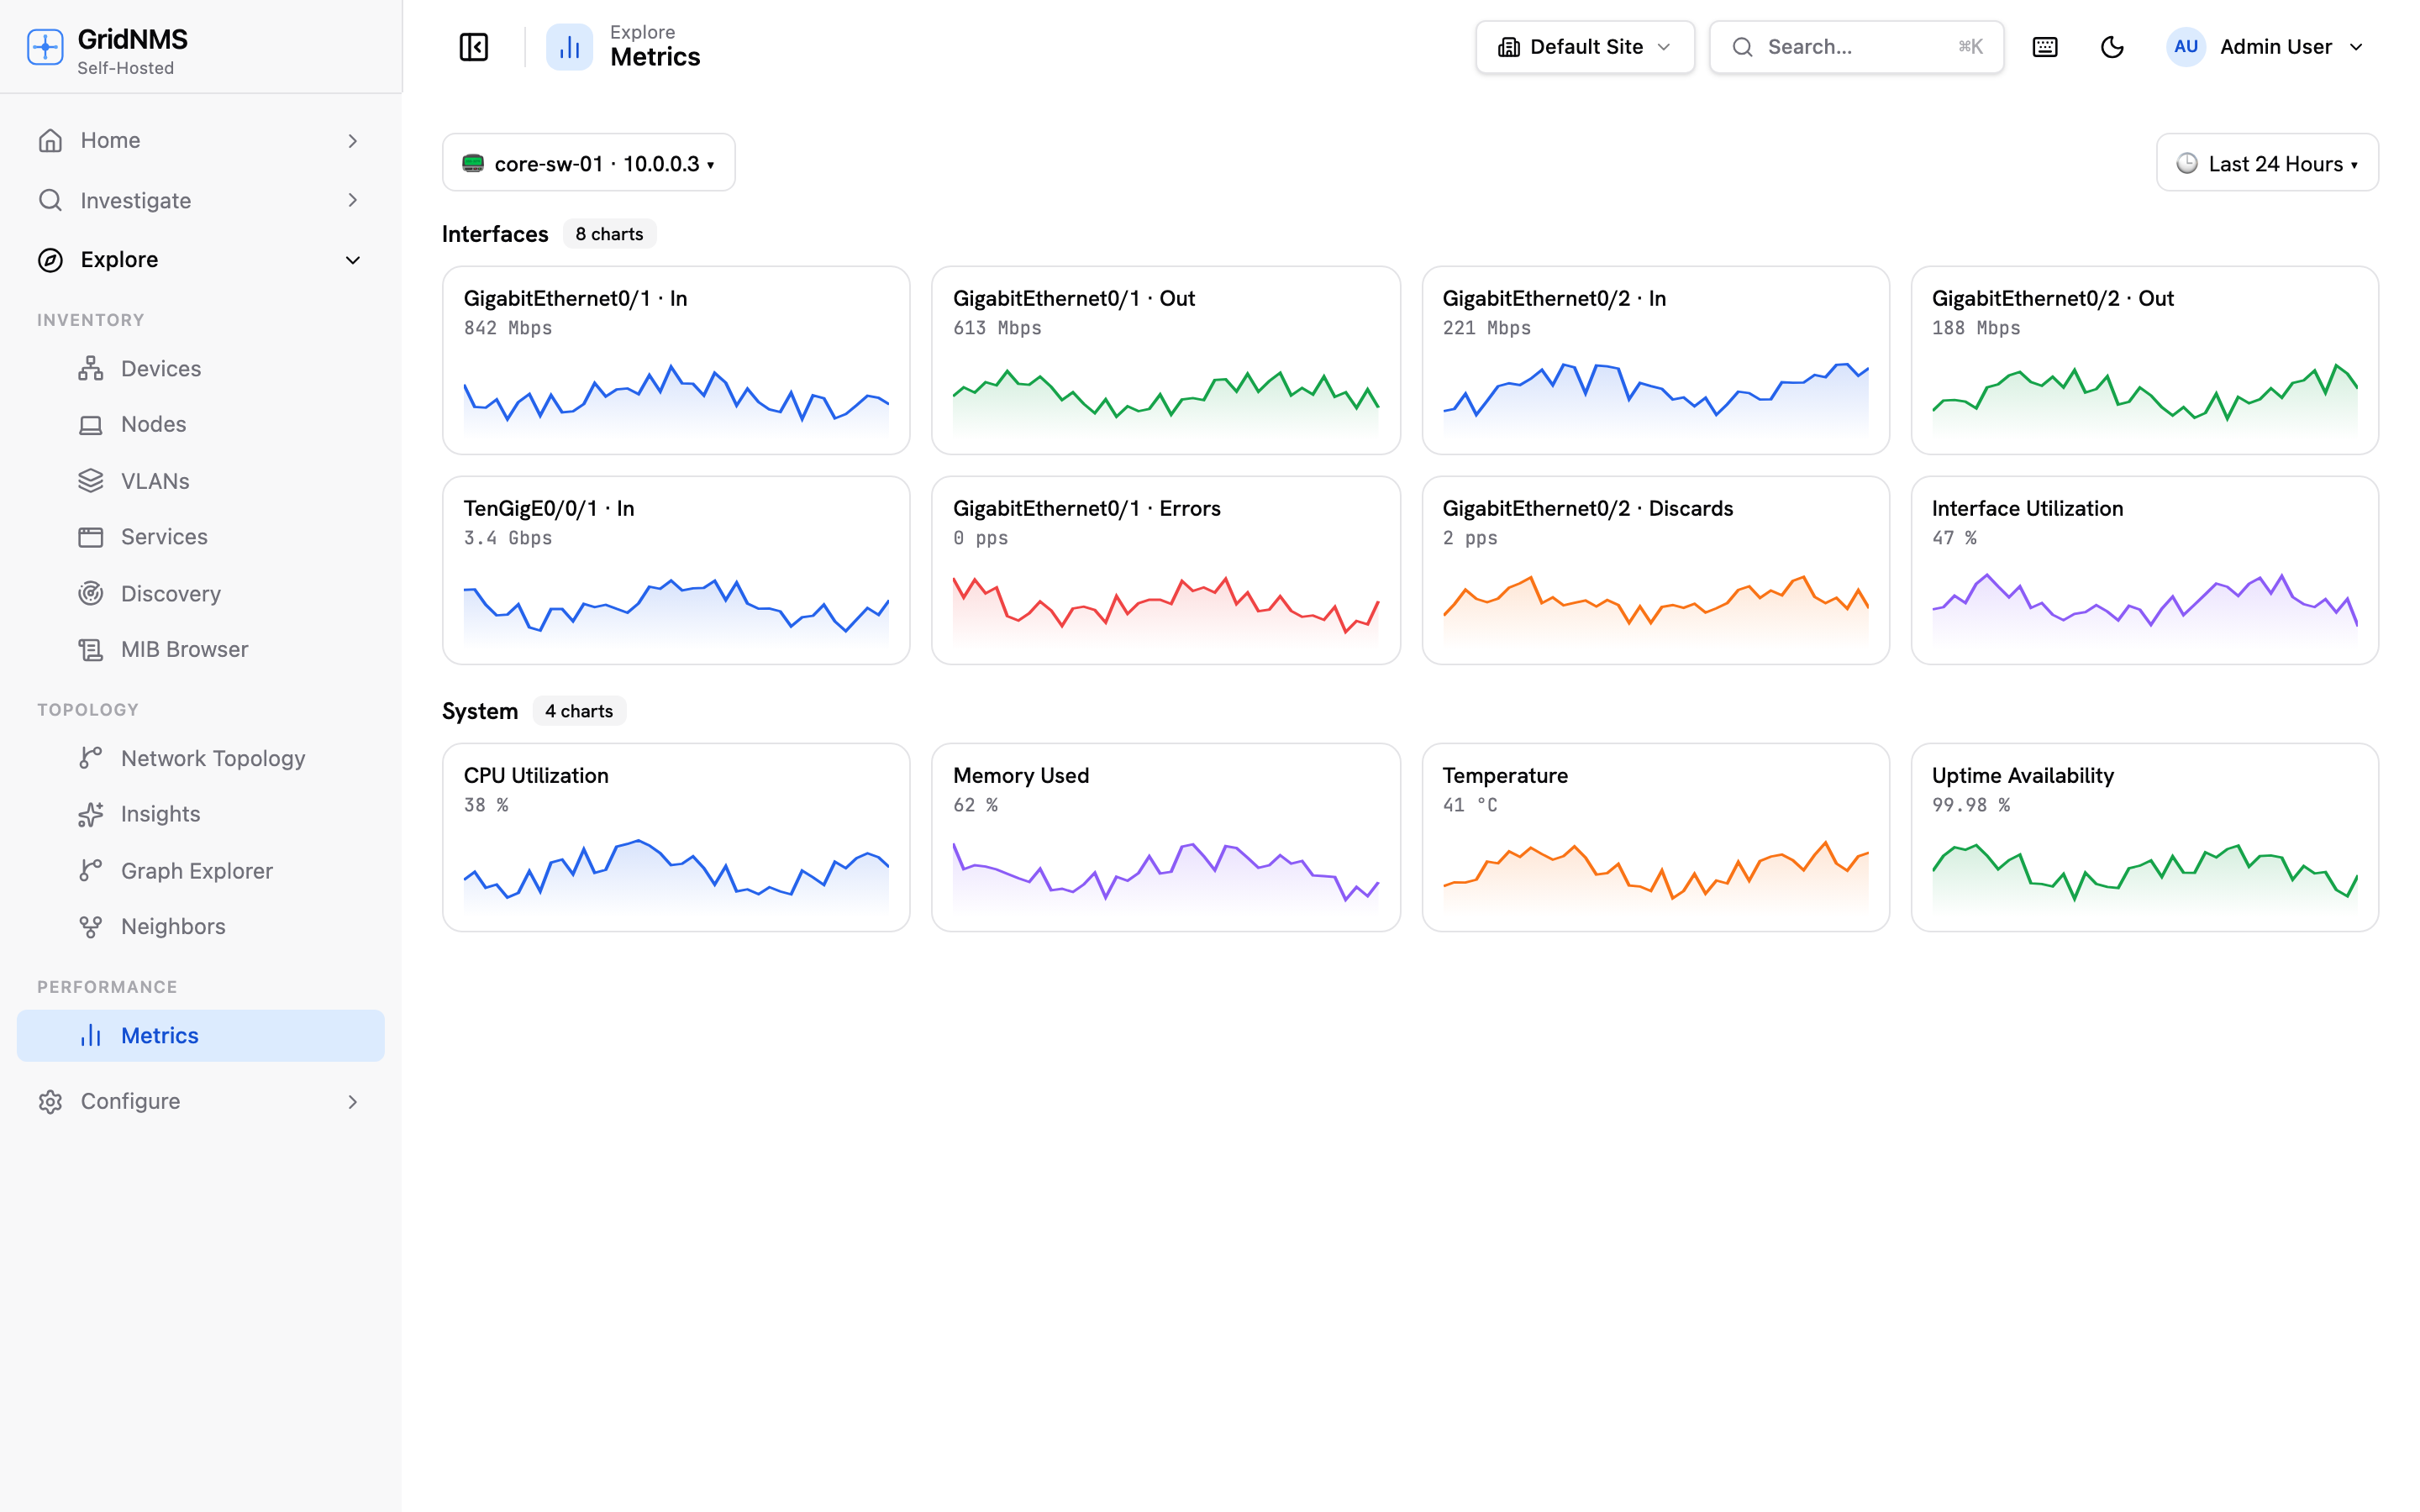
Every device, polled and understood.
ICMP, SNMP, SSH, and REST collection through reusable monitoring packs — per-interface traffic, errors, and system health, with per-second rates already computed server-side.
- Continuous uptime checks — alerted the moment a device drops.
- 25+ vendor packs, MIB-verified: Cisco, Juniper, Fortinet, Aruba, and more.
Model the service. Watch health roll up the graph.
A service is built from components — devices, discovered applications, or endpoints — linked by hard and soft dependencies. Health rolls up the graph automatically, so a service's status always reflects everything running underneath it, checked from your own collectors.
- Hard dependencies fail the parent, soft ones only degrade it, so you always see the blast radius of a single failure.
- Component health comes from monitors and metric signals — thresholds on data you're already collecting. A failing signal becomes an event, then a case.
See the blast radius before you act.
Links are discovered automatically from LLDP and CDP, then modeled on a live graph. When a device fails, the upstream root cause and every affected downstream device are right there.
- Dependency and impact analysis across the whole topology.
- Layouts and filters by class, layer, site, and status.
Syslog and traps, parsed and searchable.
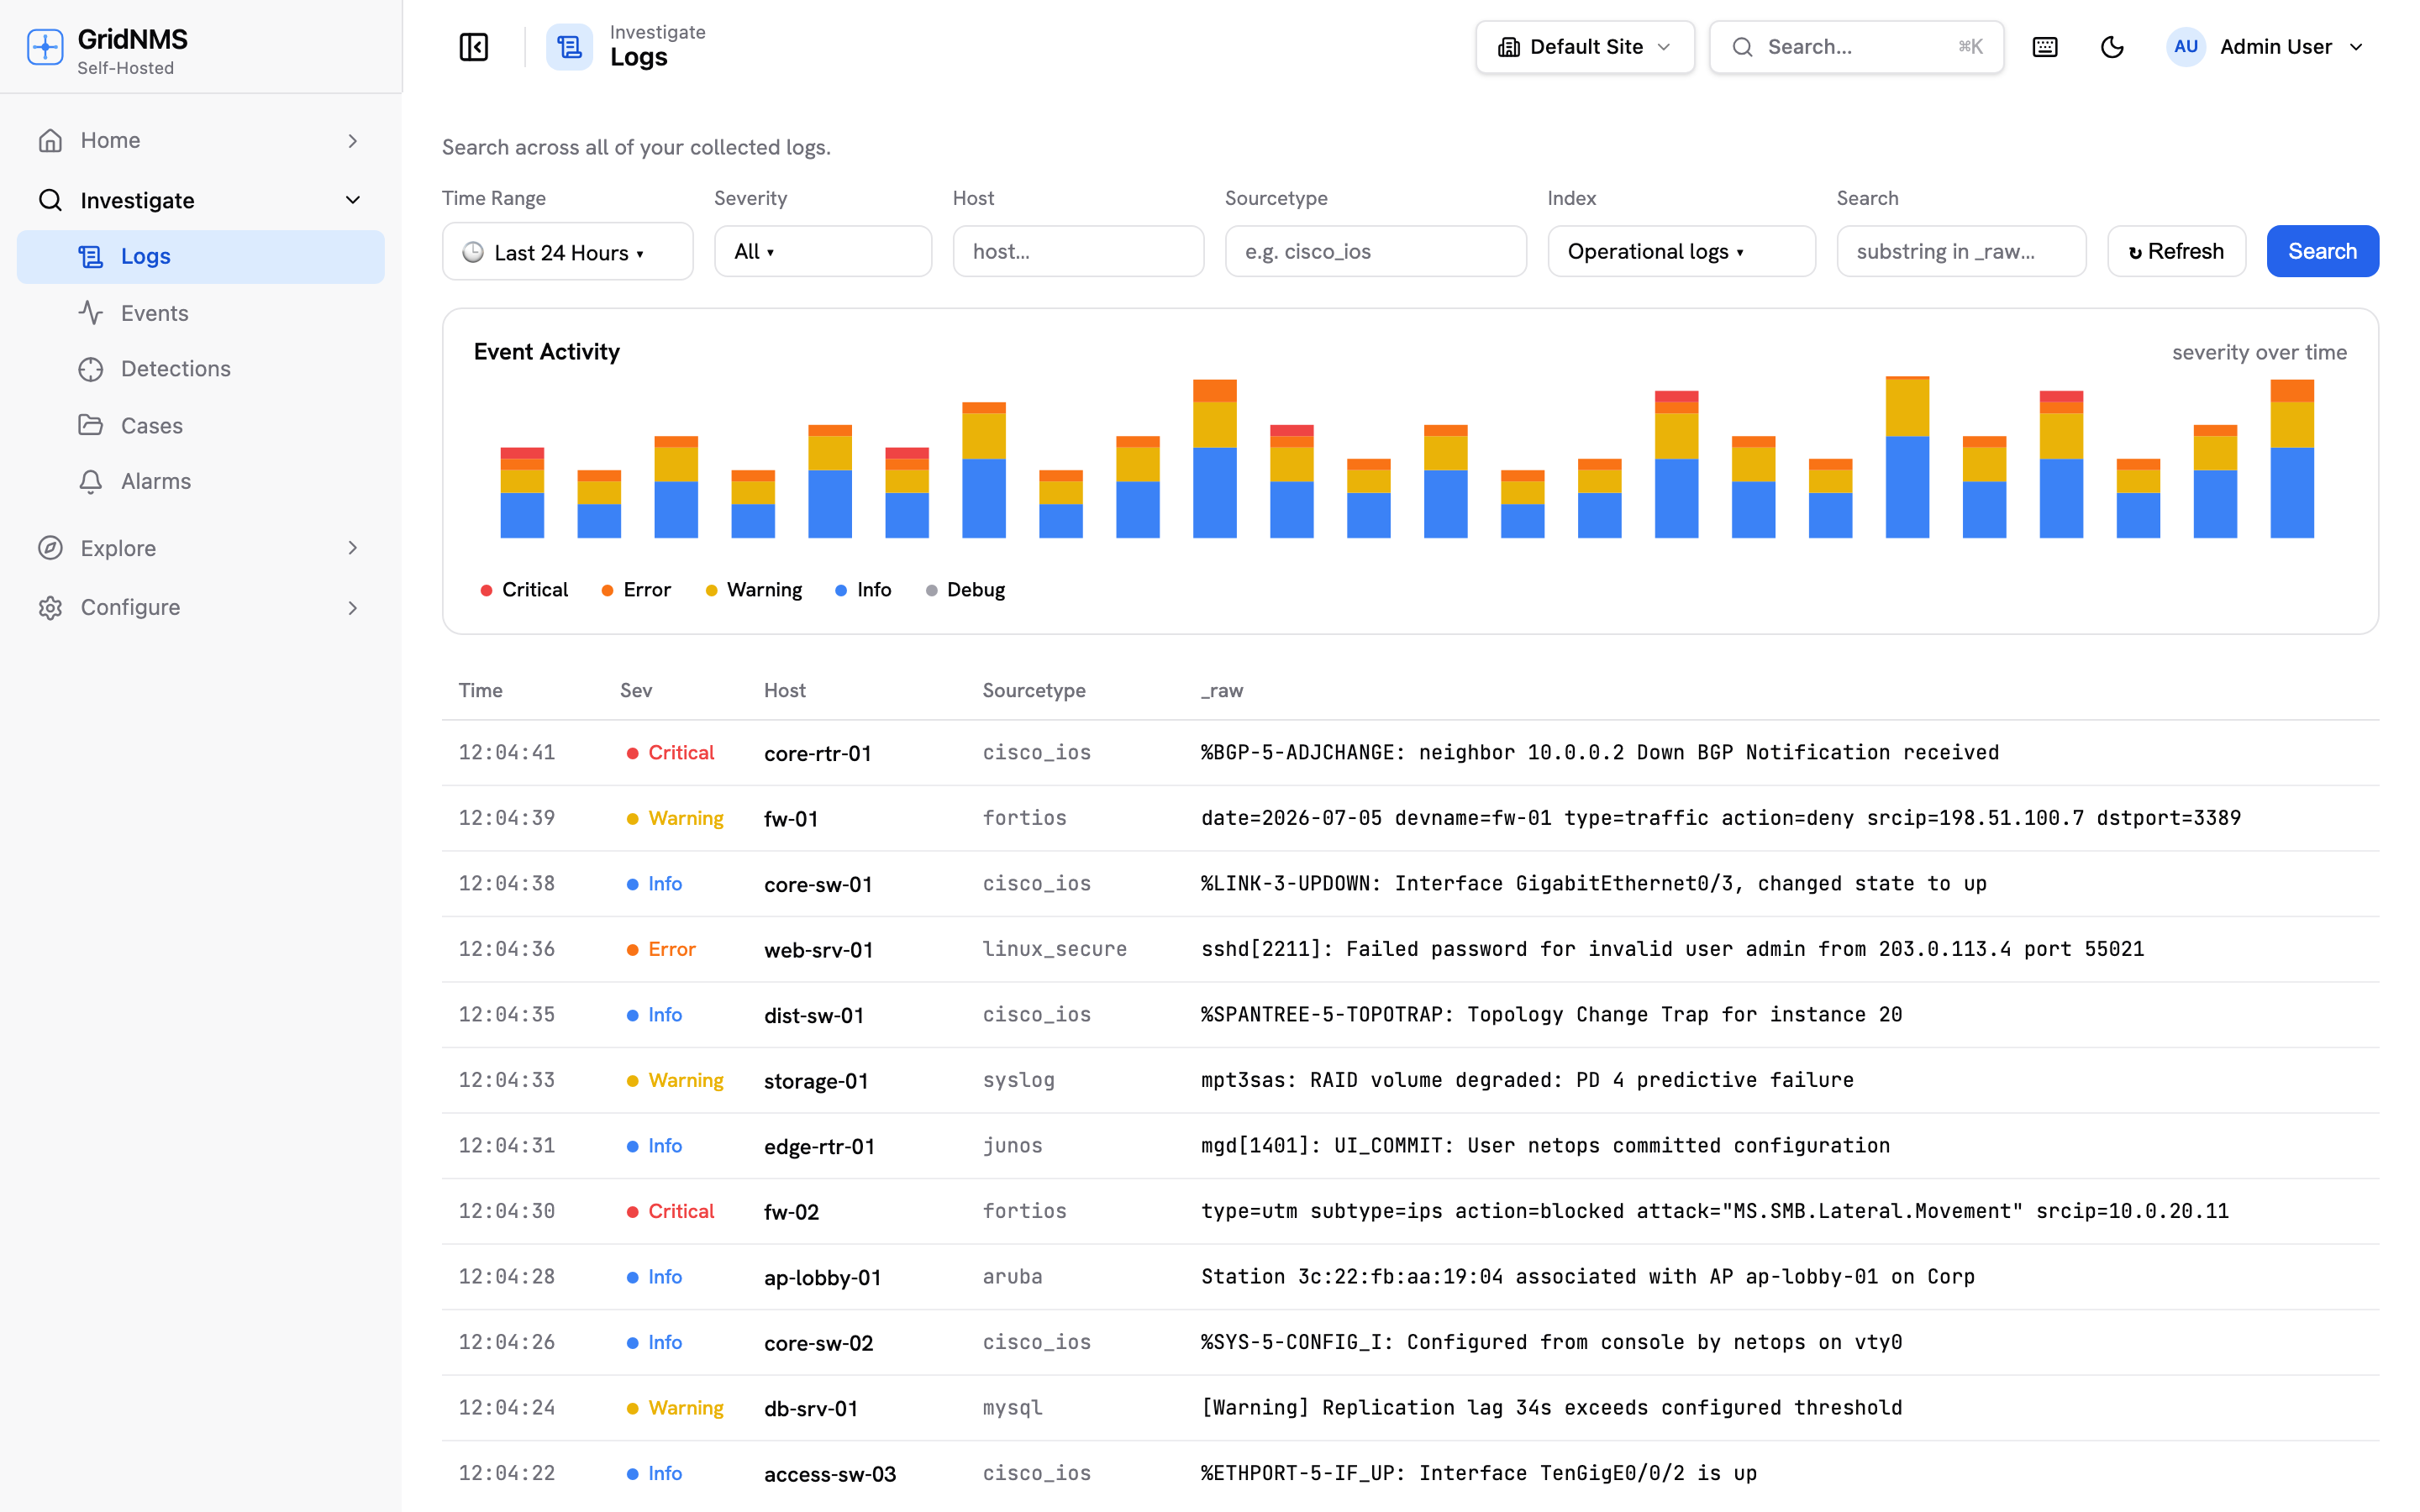
Ingest syslog and SNMP traps at volume, extract structured fields from raw lines, and search across the fleet or one device — with a full year of retention and cheaper cold storage beyond it.
- Field extraction turns raw logs into searchable, typed fields.
- Per-tenant retention by age or size, with a queryable cold tier.
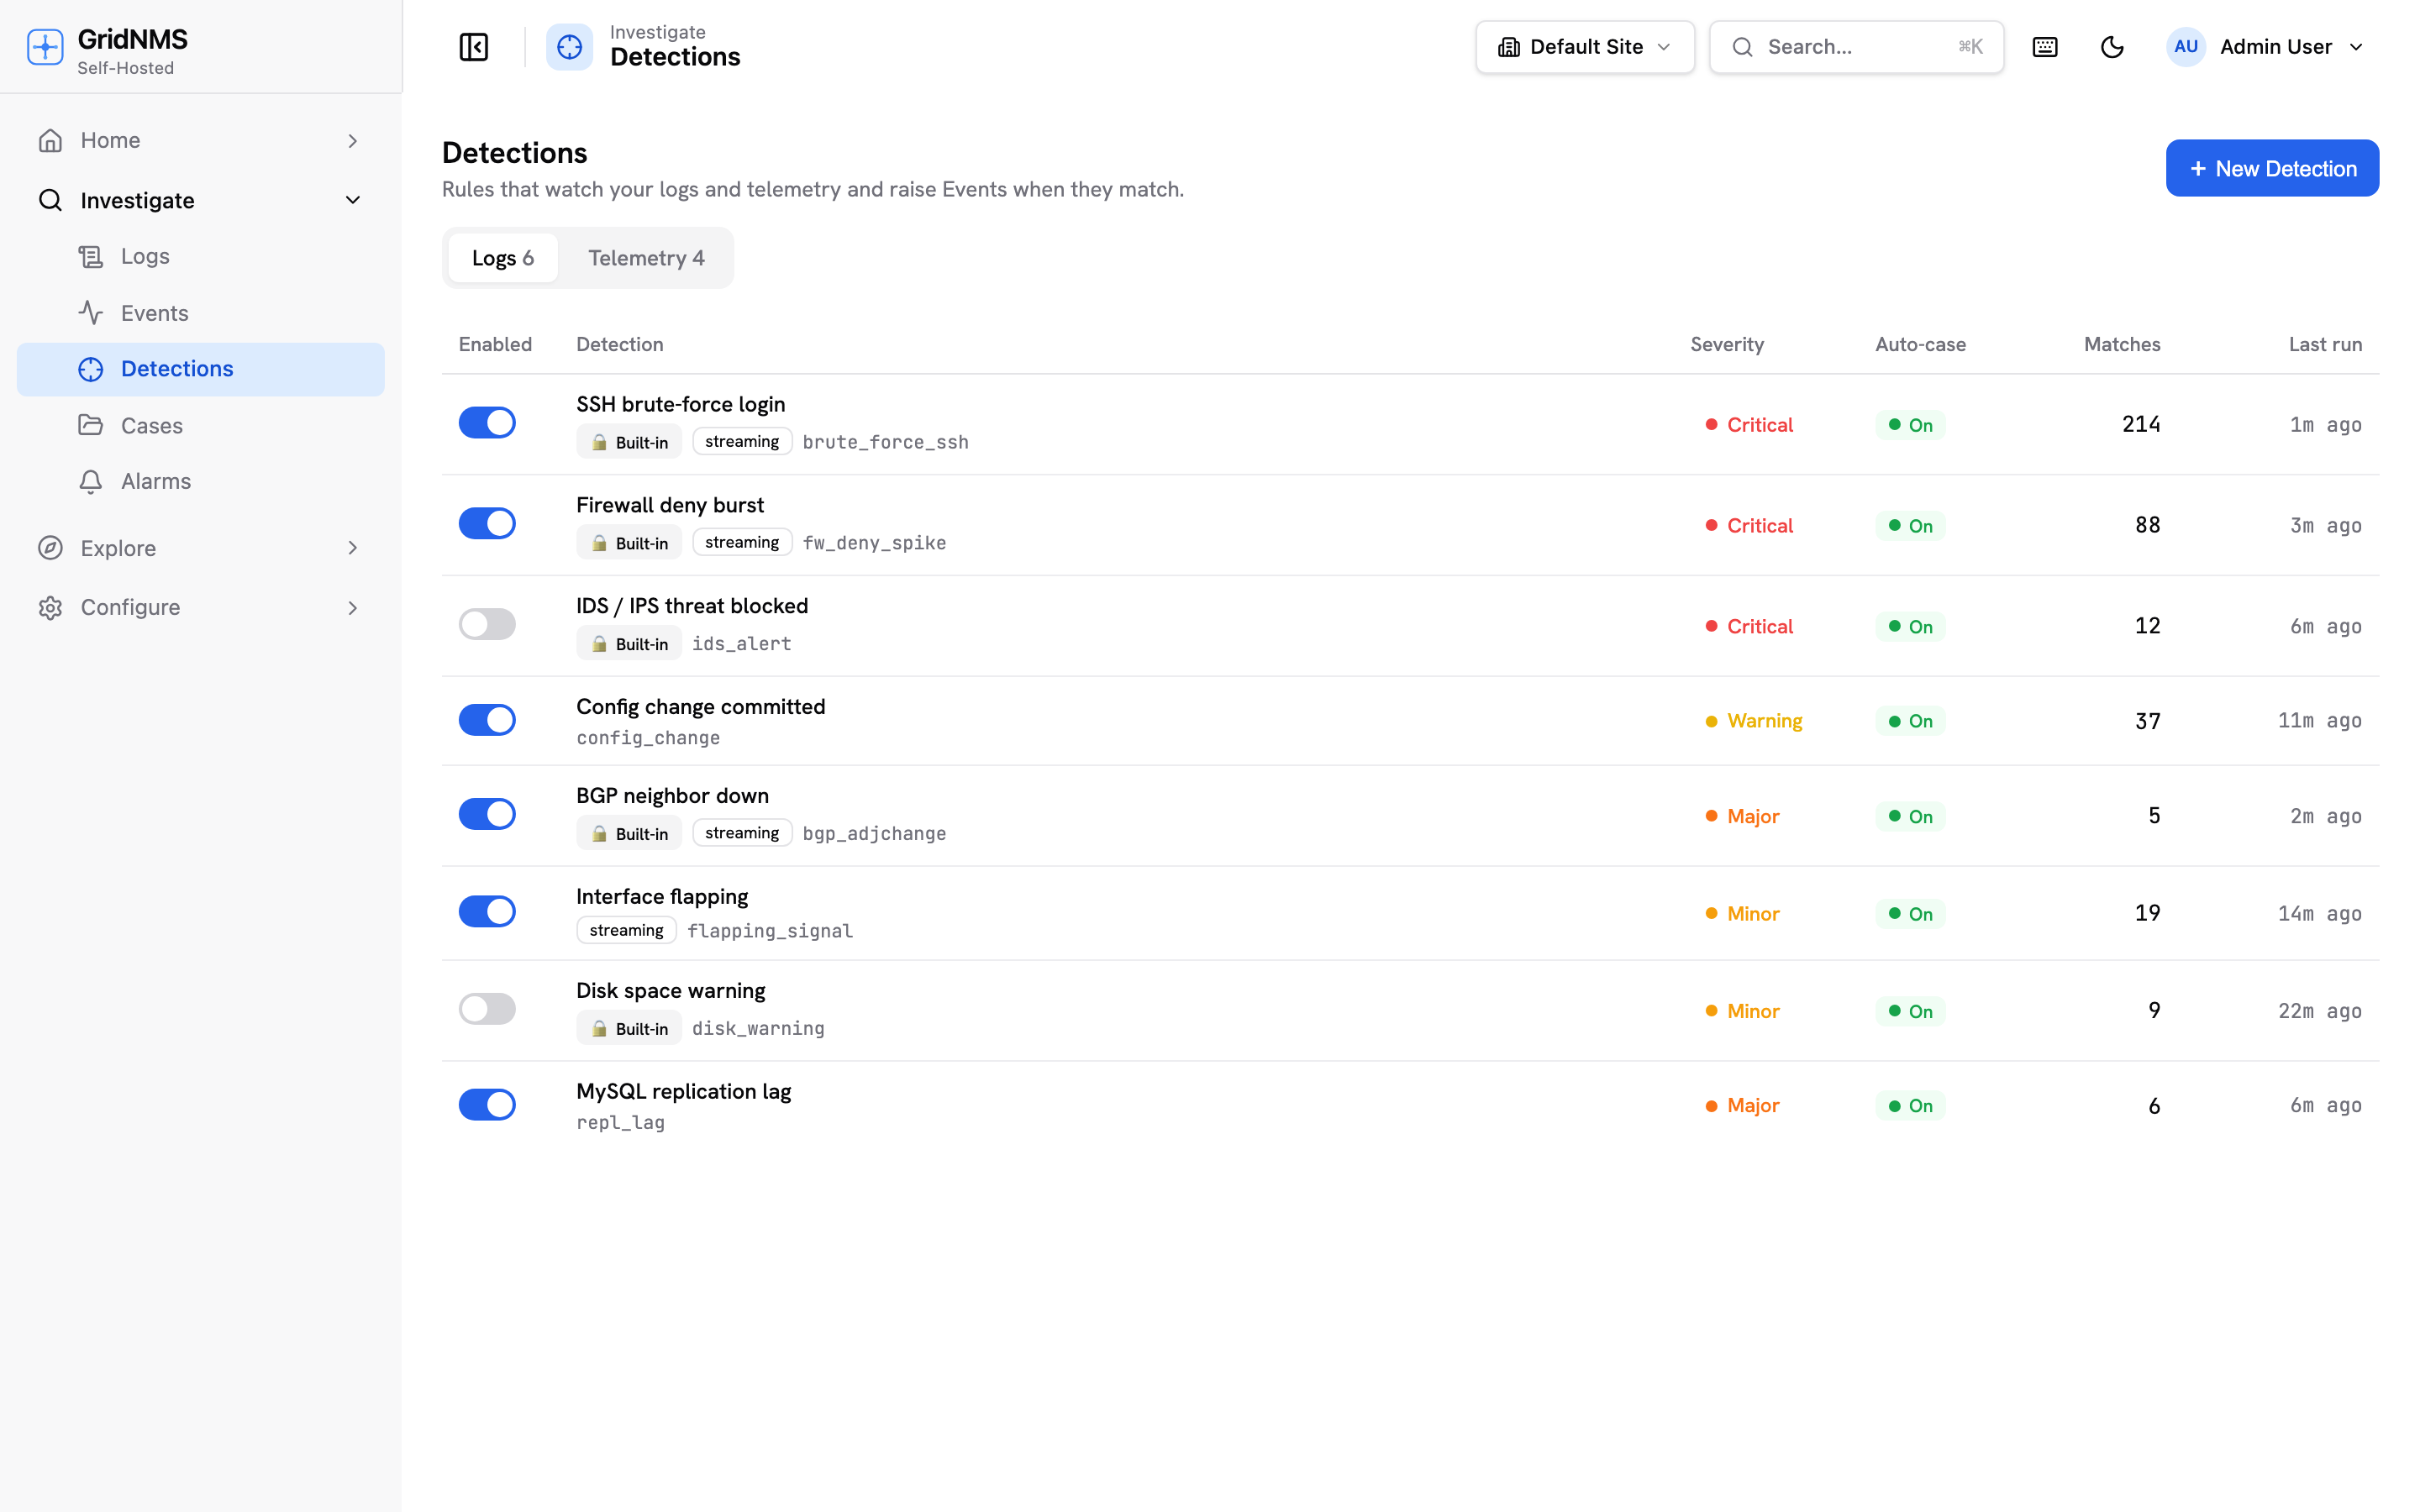
One detection language for logs and metrics.
Write detections in YARA-L and run them across logs and telemetry alike — scheduled for coverage or streaming at ingest. Every hit is an immutable event; case rules group the noise and alert once.
- Hybrid engine: scheduled windows plus real-time streaming.
- Related and flapping events correlate into a single case, automatically.
Agent-less, and outbound only.
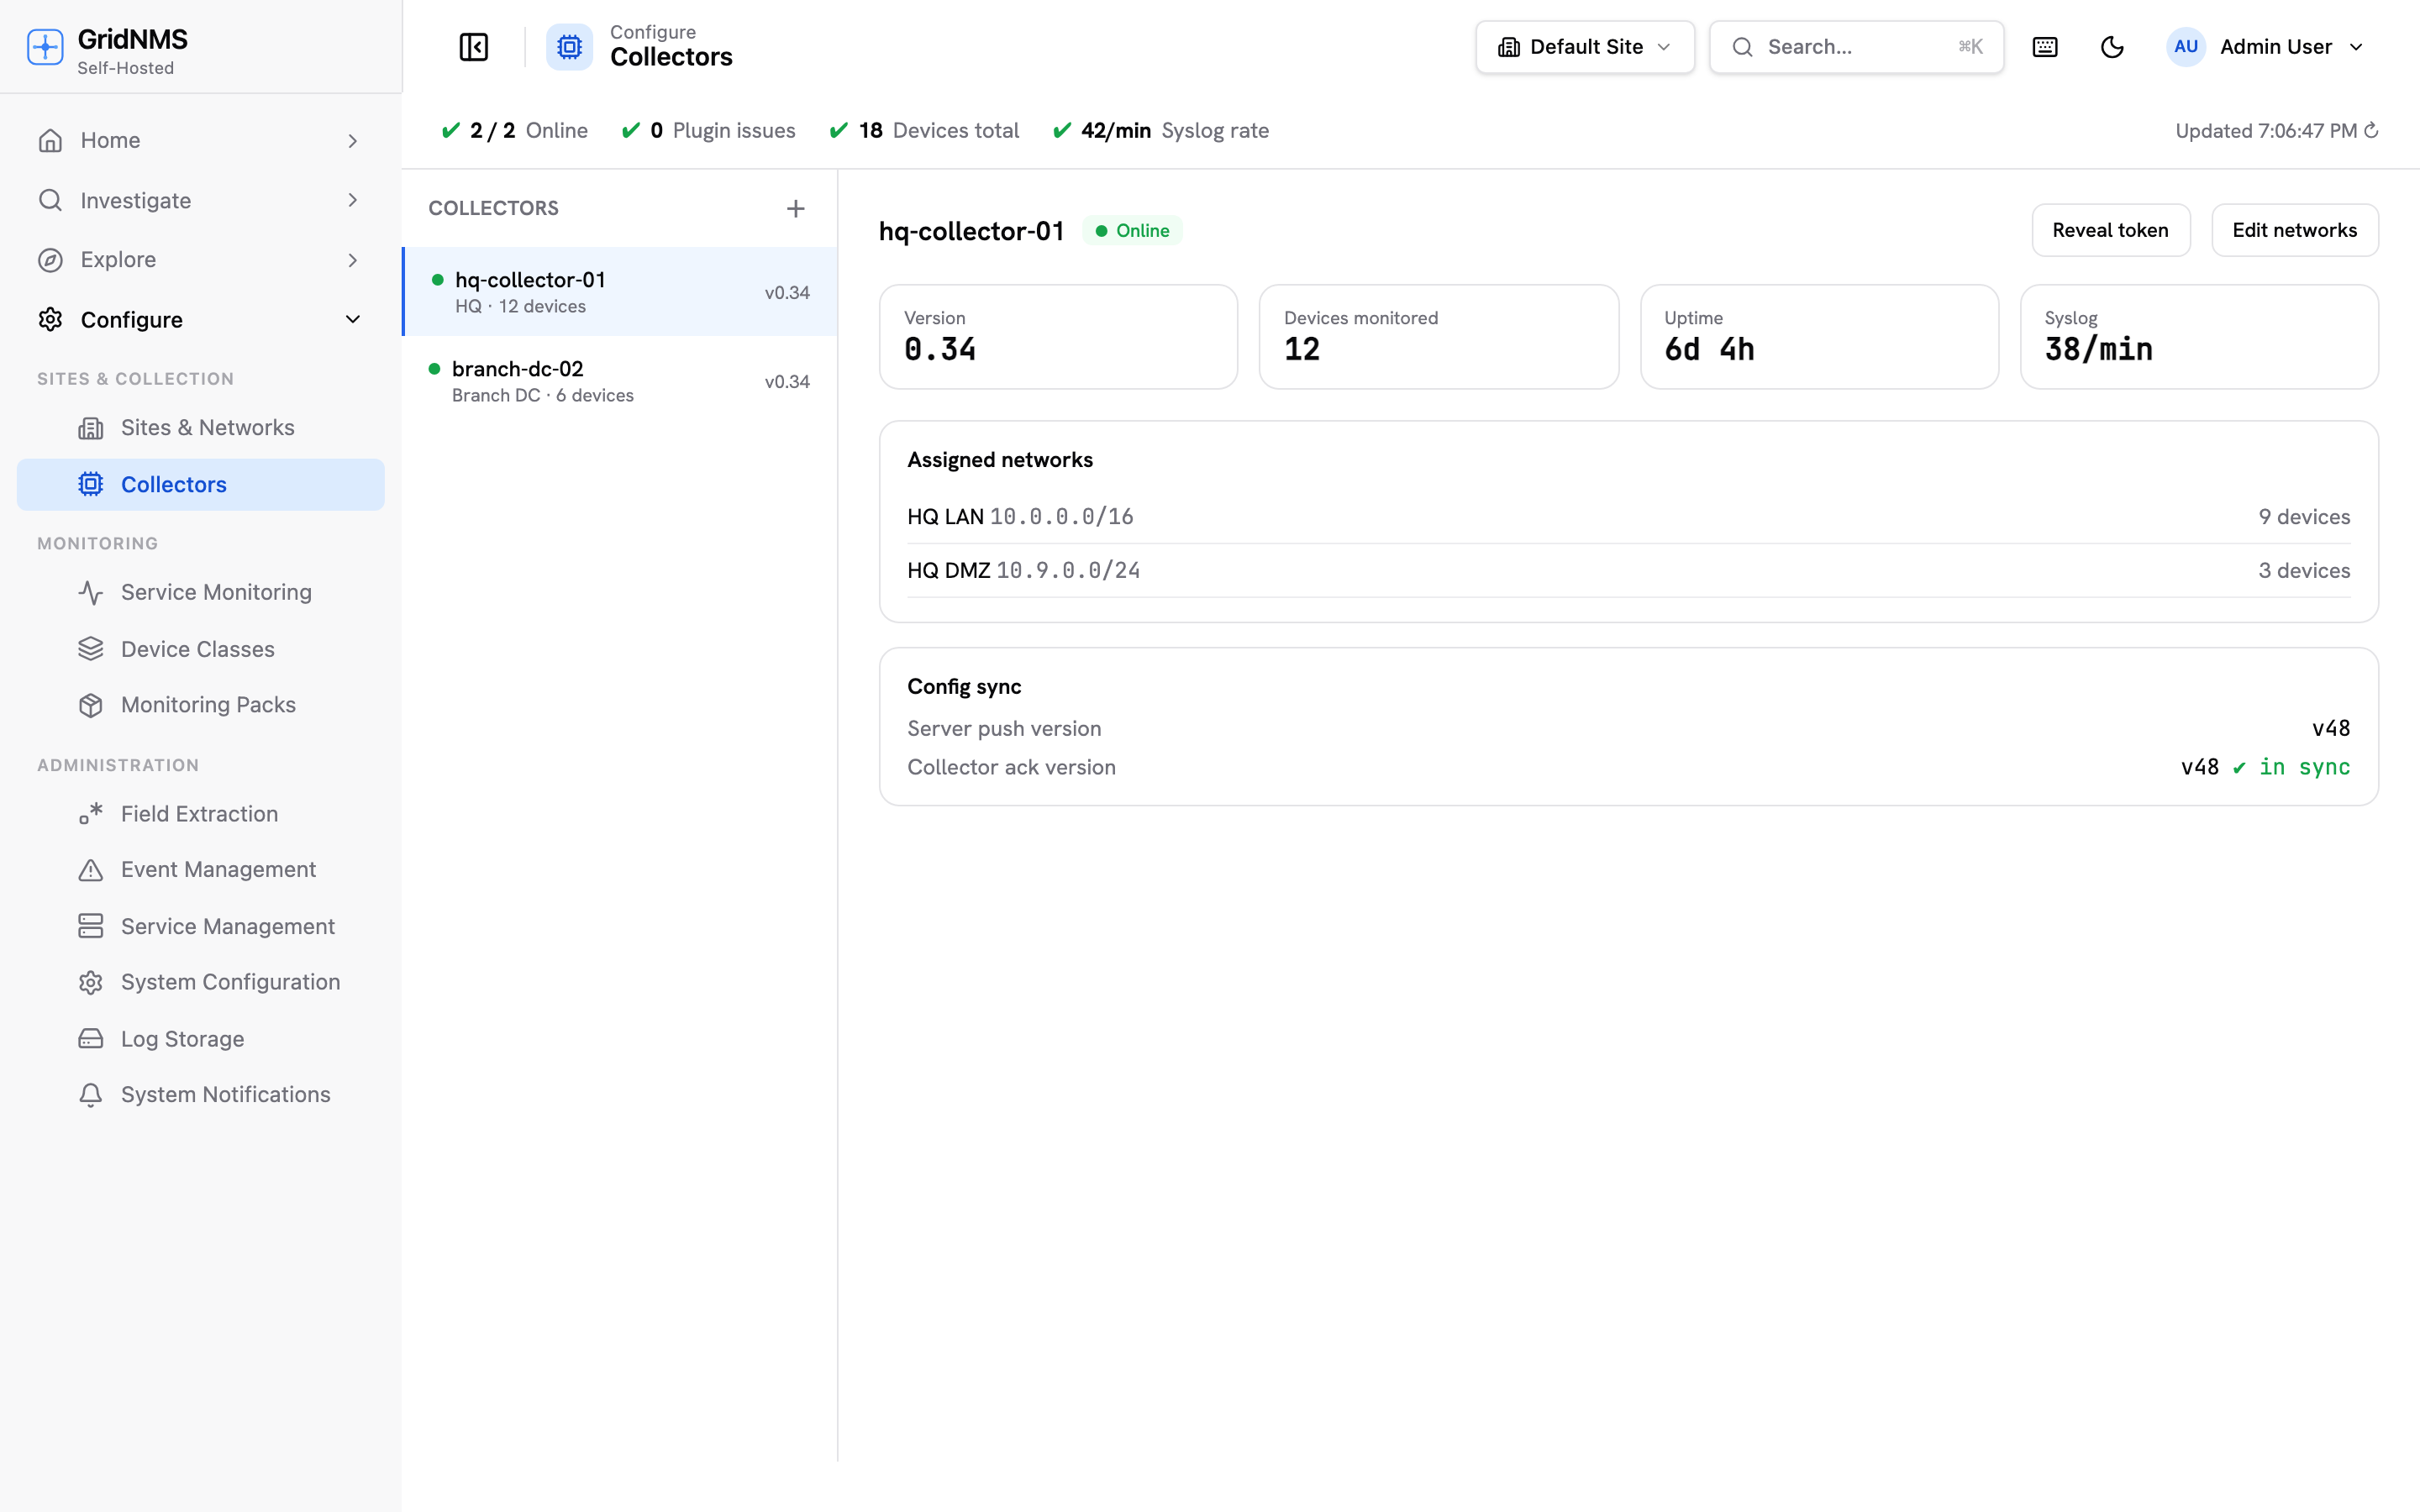
A lightweight collector runs in your network as the single collection point for all telemetry. It connects outbound to the Grid, so there are no inbound ports to open.
- No per-device agents; assigned to networks.
- Load-balanced backup collectors for per-site fault tolerance.
How it works
Collection runs inside your network. Correlation, detection, and alerting run in the Grid.
Discover & collect
A collector scans for hosts and services, polls SNMP/SSH/ICMP, and receives syslog and traps.
Correlate
Metrics, logs, and topology come together: devices mapped onto a live graph with their dependencies.
Detect
YARA-L detections and interface thresholds turn signal into prioritized events across logs and metrics.
Resolve
Events group into cases and alert once, to email, Slack, webhooks, or PagerDuty.
Problem-first, on day one.
The product is one platform; these are the jobs network and infrastructure teams reach for it to do first.
Replace SolarWinds
Retire a heavy legacy NMS and a pile of scripts. Monitoring, logs, and topology land in one agent-less platform with vendor packs that work on day one.
See the comparisonFrom syslog to detections to cases
Turn raw syslog and traps into structured, searchable signal, run YARA-L detections over it, and let case rules group the storm into one alert with full context.
See the workflowMulti-site & MSP monitoring
Discover and monitor every branch or client from one pane, organized by site, with role-based access so each team — or customer — sees only what it owns.
See how it scalesSelf-hosted & air-gapped
Run the same platform on your own hardware with Docker, or fully offline for environments that can't phone home. Your data never leaves your building.
See deployment optionsThe gear you already run.
Monitoring packs ship for the major vendors, built from published MIBs — and everything speaks the open protocols your network already emits.
Need a vendor that isn't listed? Upload its MIBs and pack bundles — OIDs and device tabs appear automatically. Browse vendor packs →
Rapid deployment.
A guided Deployment Checklist takes you from an empty account to a fully monitored network with alerting — the moment you sign in. No guessing what to do next.
- Self-verifying. Each step ticks itself off once the Grid confirms it's done — not just when you click.
- Every step deep-links to the exact page that satisfies it, so you're always one click from the next action.
- Same path everywhere — identical on GridNMS Cloud and self-hosted. Dismiss it any time and reopen it from the dashboard.
Transparent, published pricing.
Cloud plans start at $99 per month, with unlimited monitored services and unlimited notifications on every tier. Or run it free, self-hosted, with the open-core Community edition. See full pricing and plans →
Cloud
Fully managed. We run it; you monitor.
- Graph correlation and impact analysis
- Host and service discovery
- YARA-L detections on logs and metrics
- Automatic case management and alerting
- Managed TLS, storage, and retention
Self-hosted
Open-core. Run it on your own infrastructure, free with the Community edition.
- Free Community edition — core monitoring, 10 devices
- One-command Docker install
- Your data stays on your hardware
- Bring your own TLS certificate
Evaluating alternatives? See how the Grid compares to SolarWinds and Auvik.
See your Grid as one system.
Every device, metric, and log on one graph. From $99/month.