Take the tour.
Six screens, one workflow: from the whole network at a glance, down to a single case with the noise already grouped. This is the product as you'll actually use it — no login required.
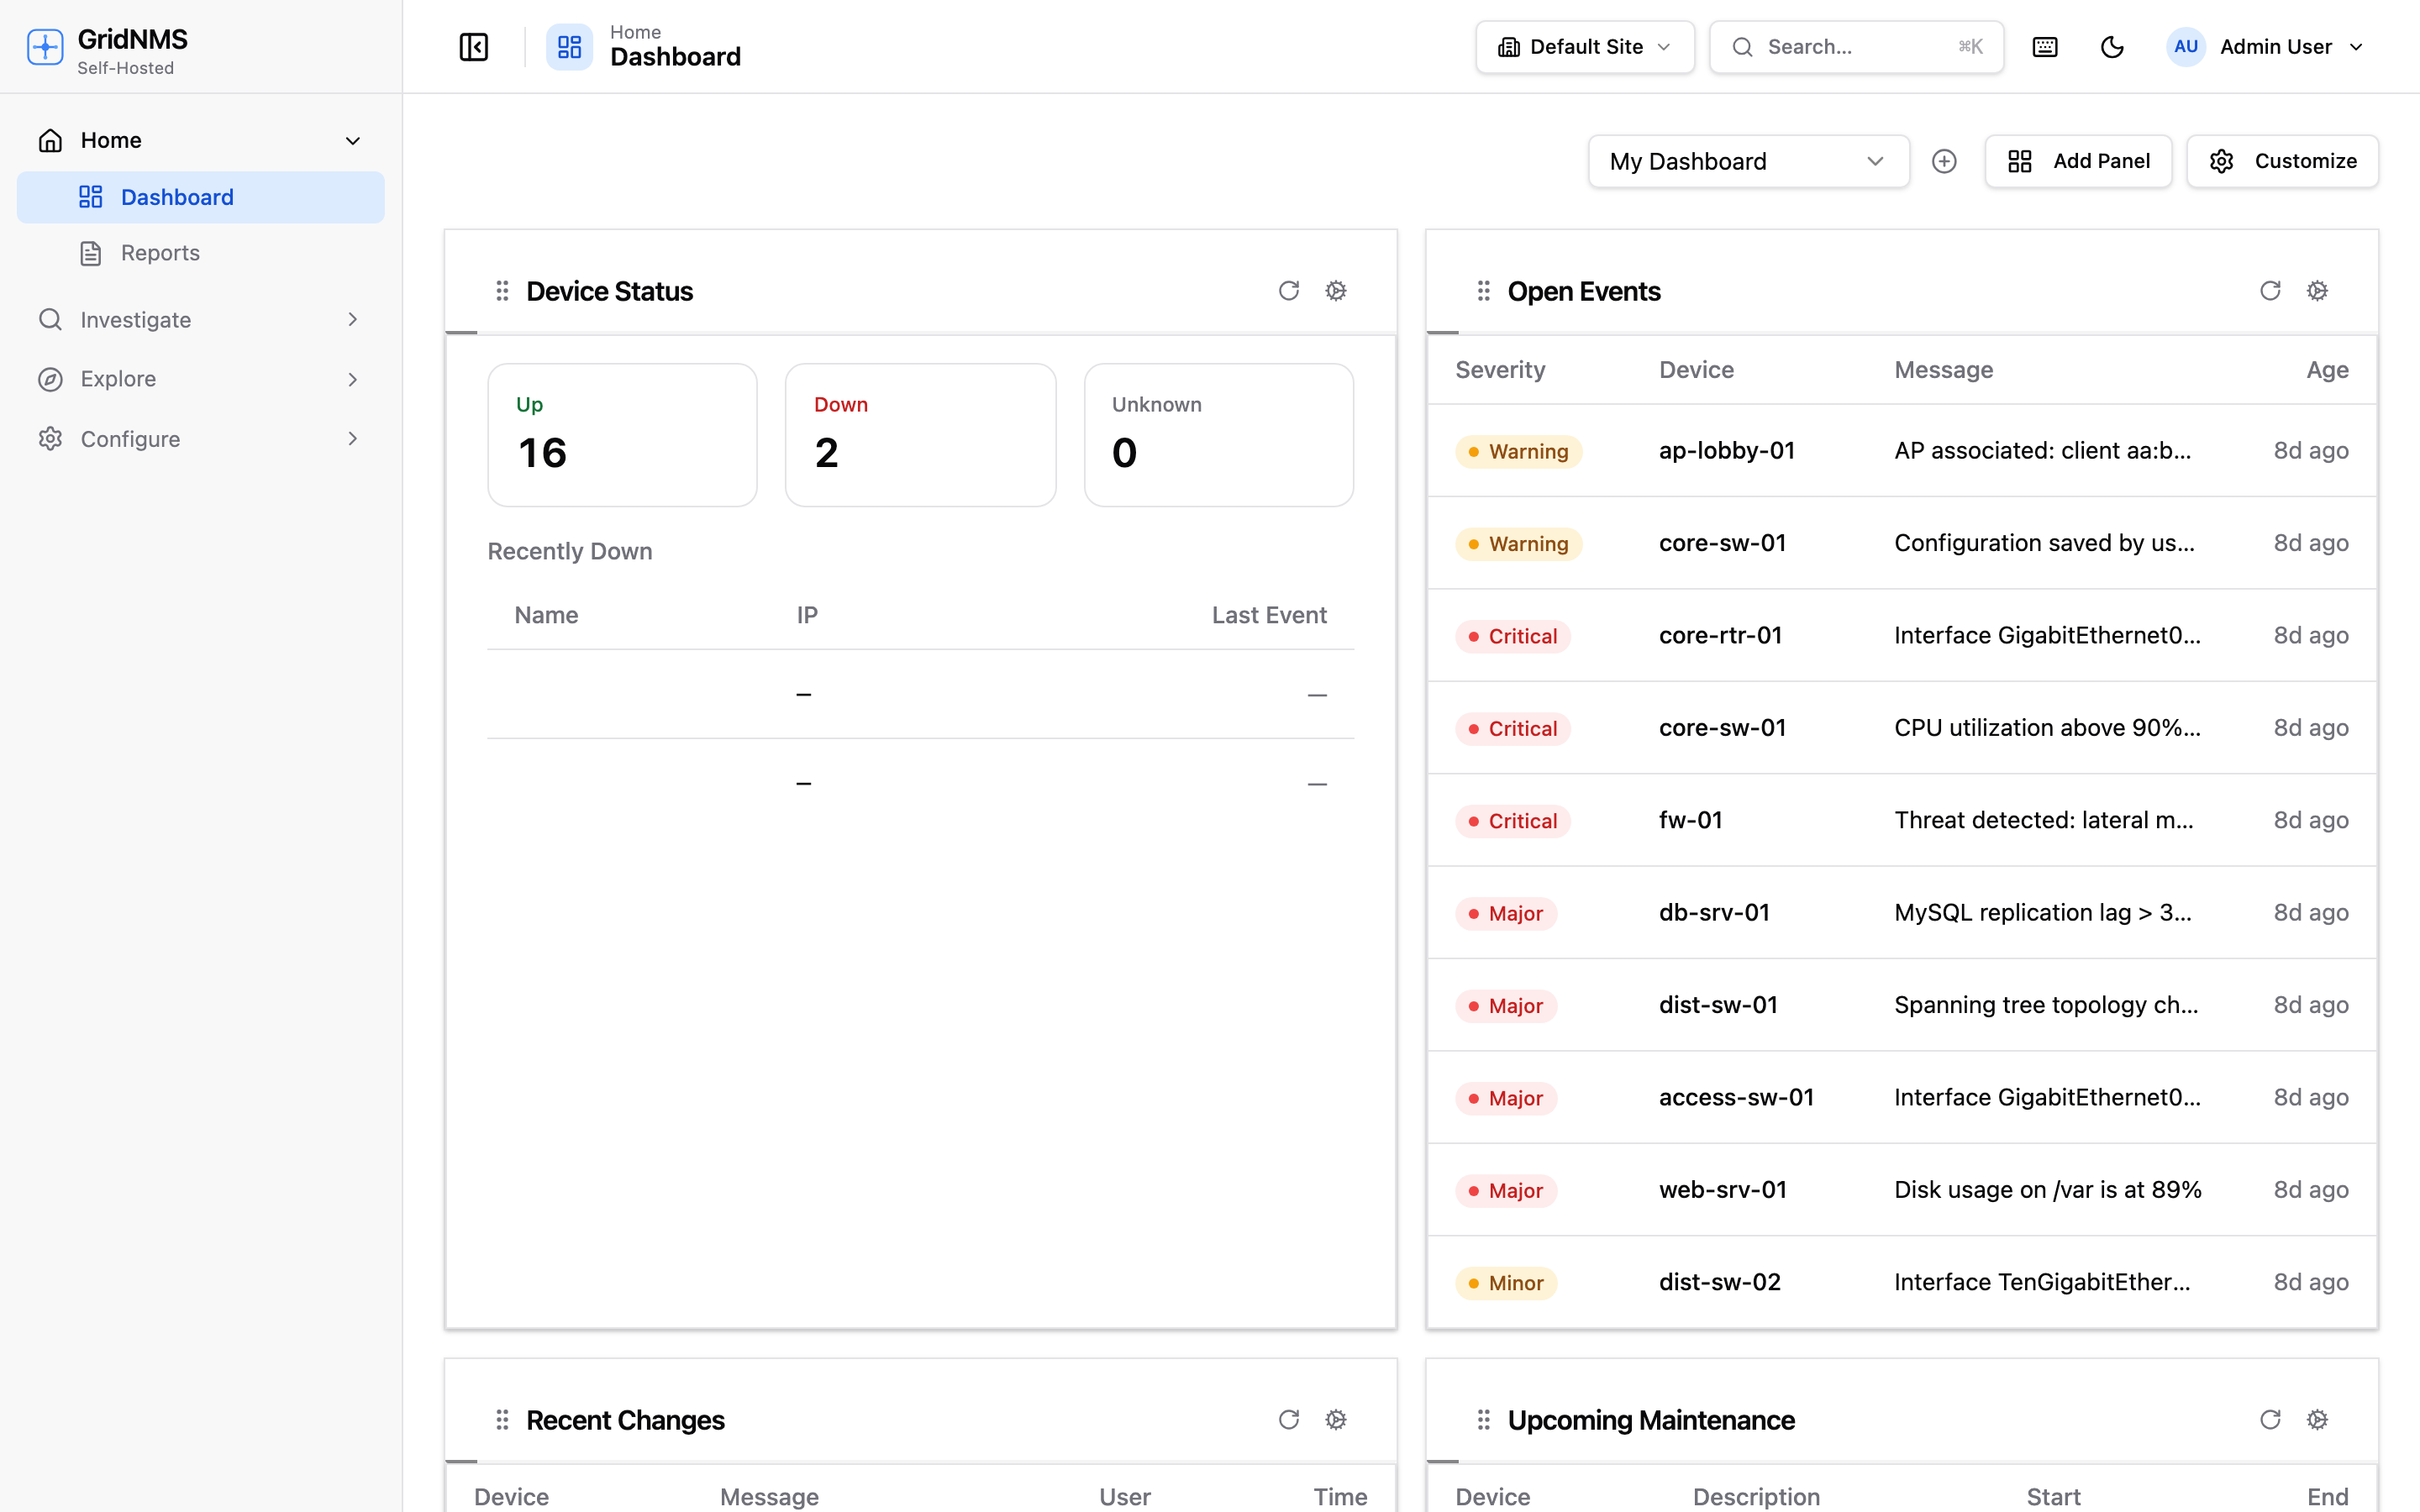
Start with the whole network at a glance.
The dashboard opens on what matters right now: how many devices are up or down, and the open events ranked by severity across your routers, switches, and firewalls. Every panel is a drag-and-drop widget, so the view is yours to arrange.
Follow the links, and the blast radius.
The topology graph maps every device and the links discovered from LLDP and CDP, colored by live status. When something goes down, you see the upstream cause and everything downstream that went with it — not forty disconnected alerts.
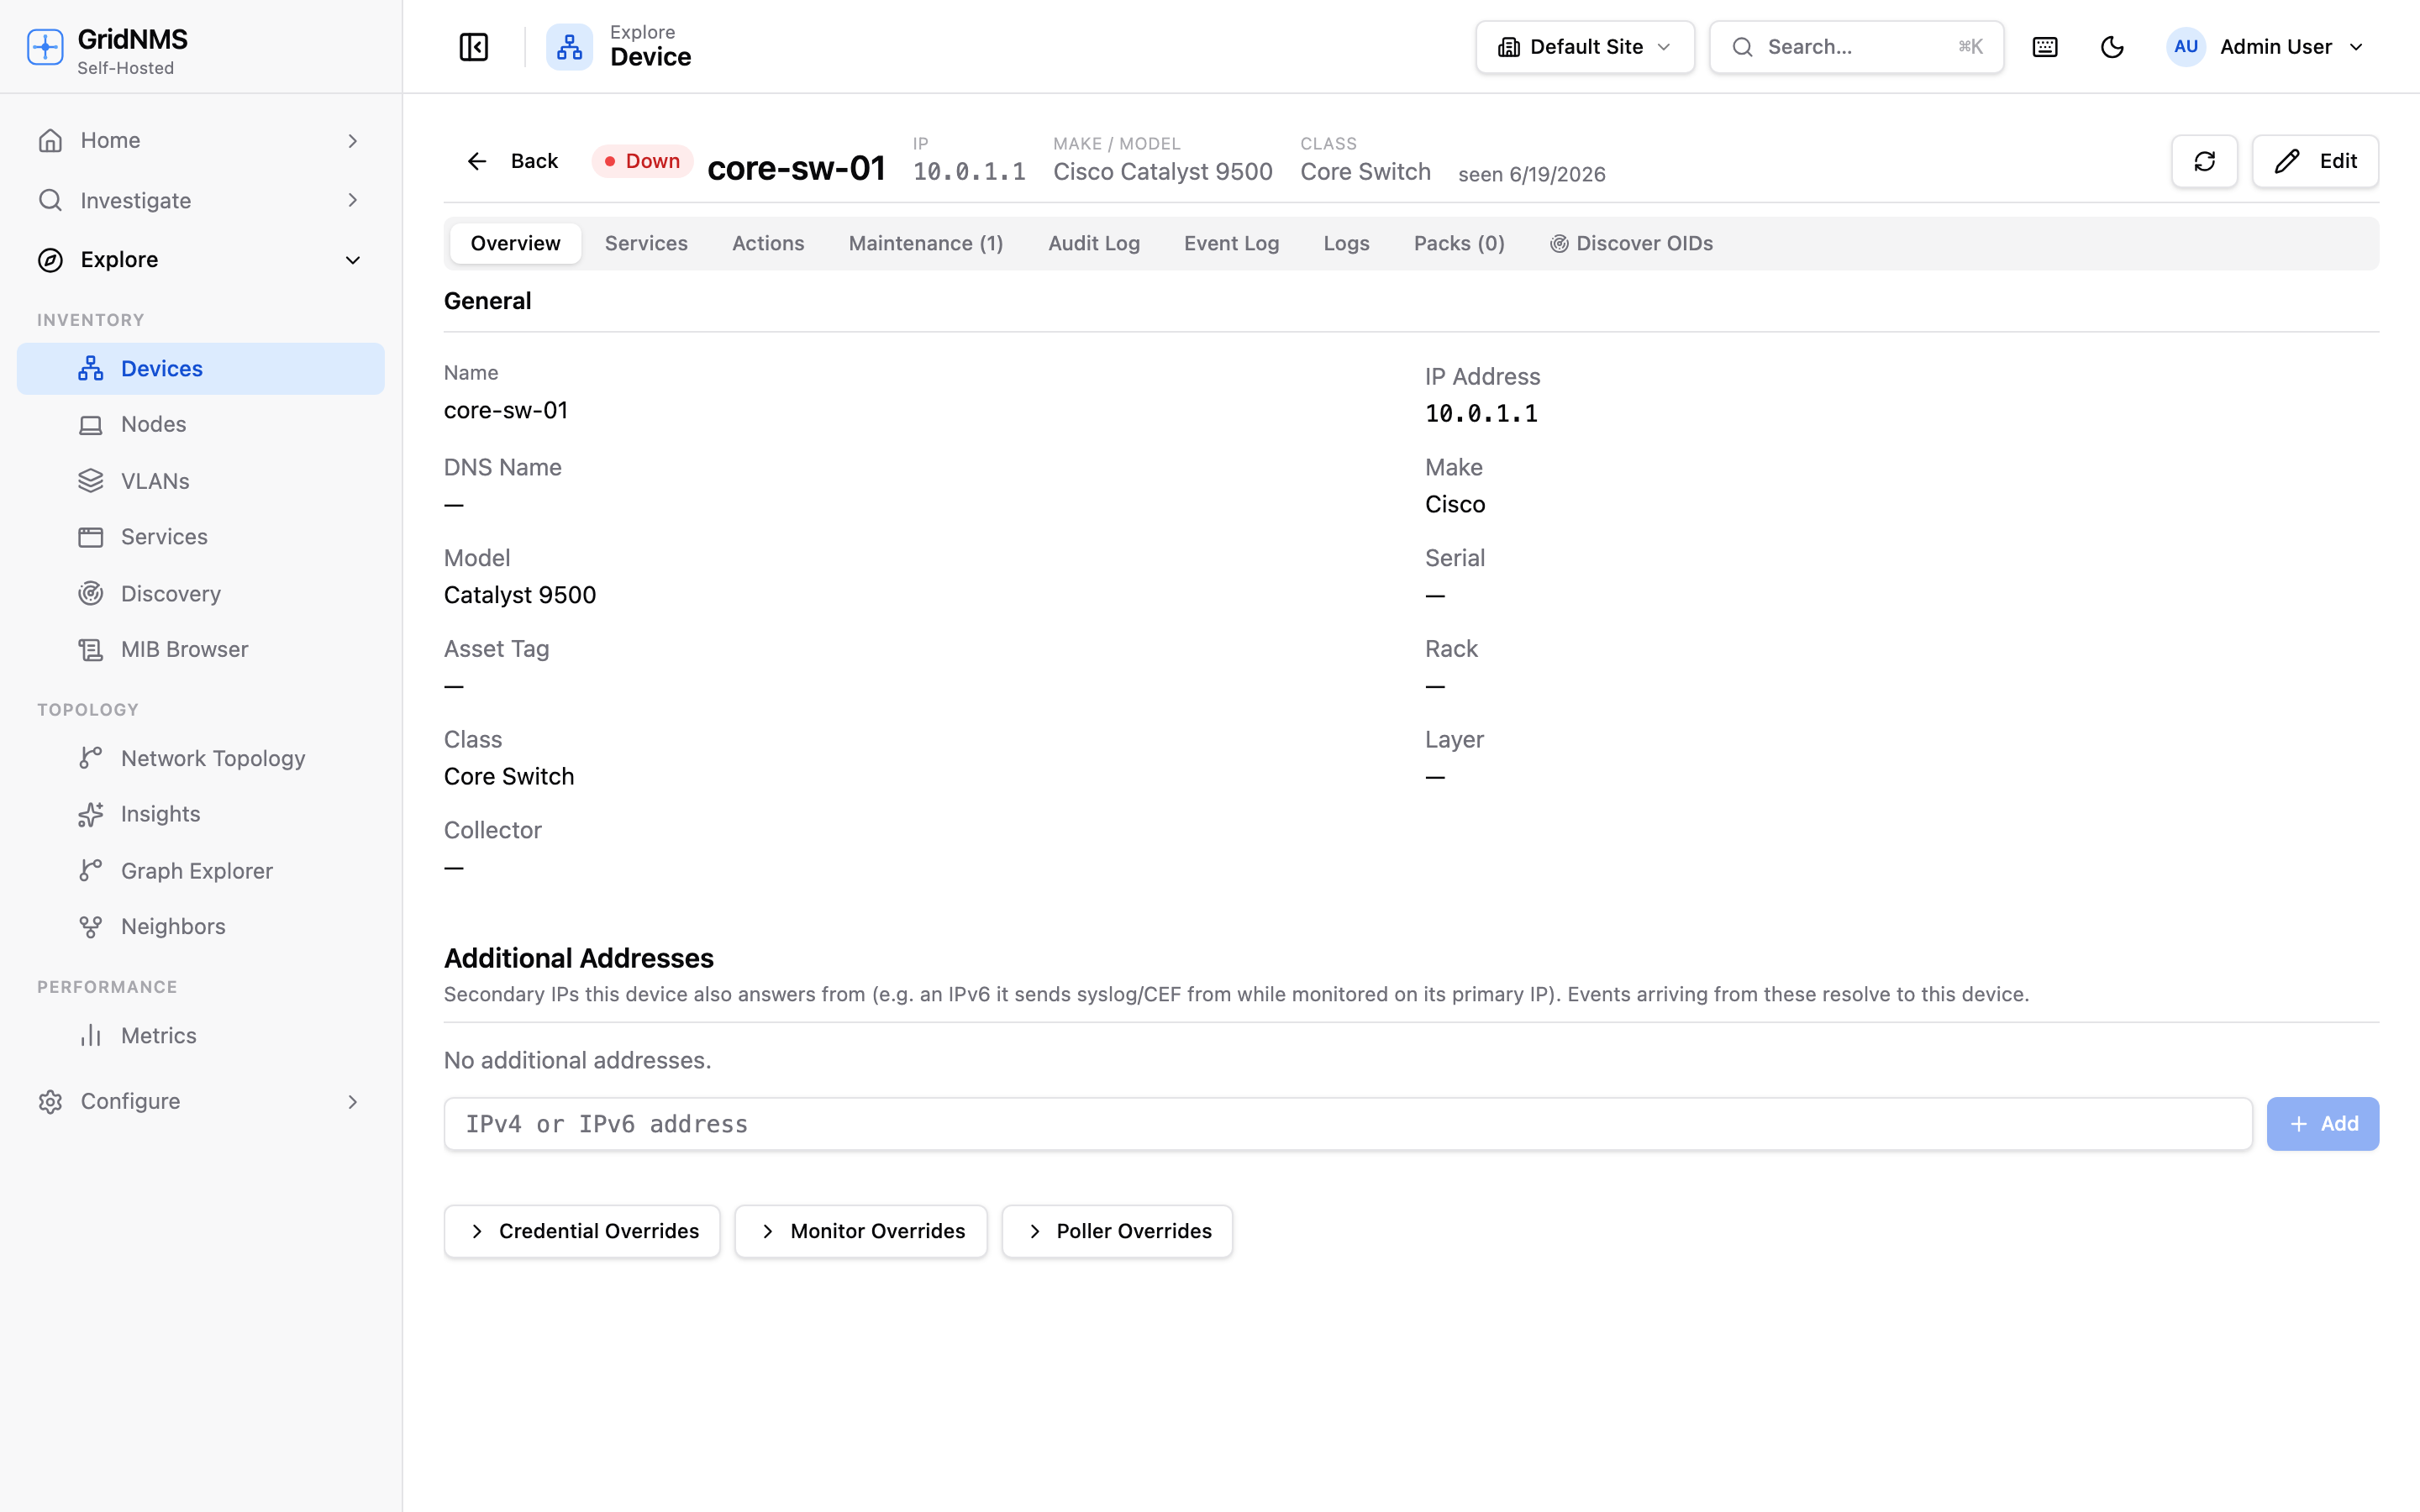
Drill into one device, end to end.
Open any device for its interfaces, metrics, logs, and neighbors on dynamic tabs driven by its monitoring pack. Per-interface traffic, errors, and system health arrive with per-second rates already computed, so the charts read at a glance.
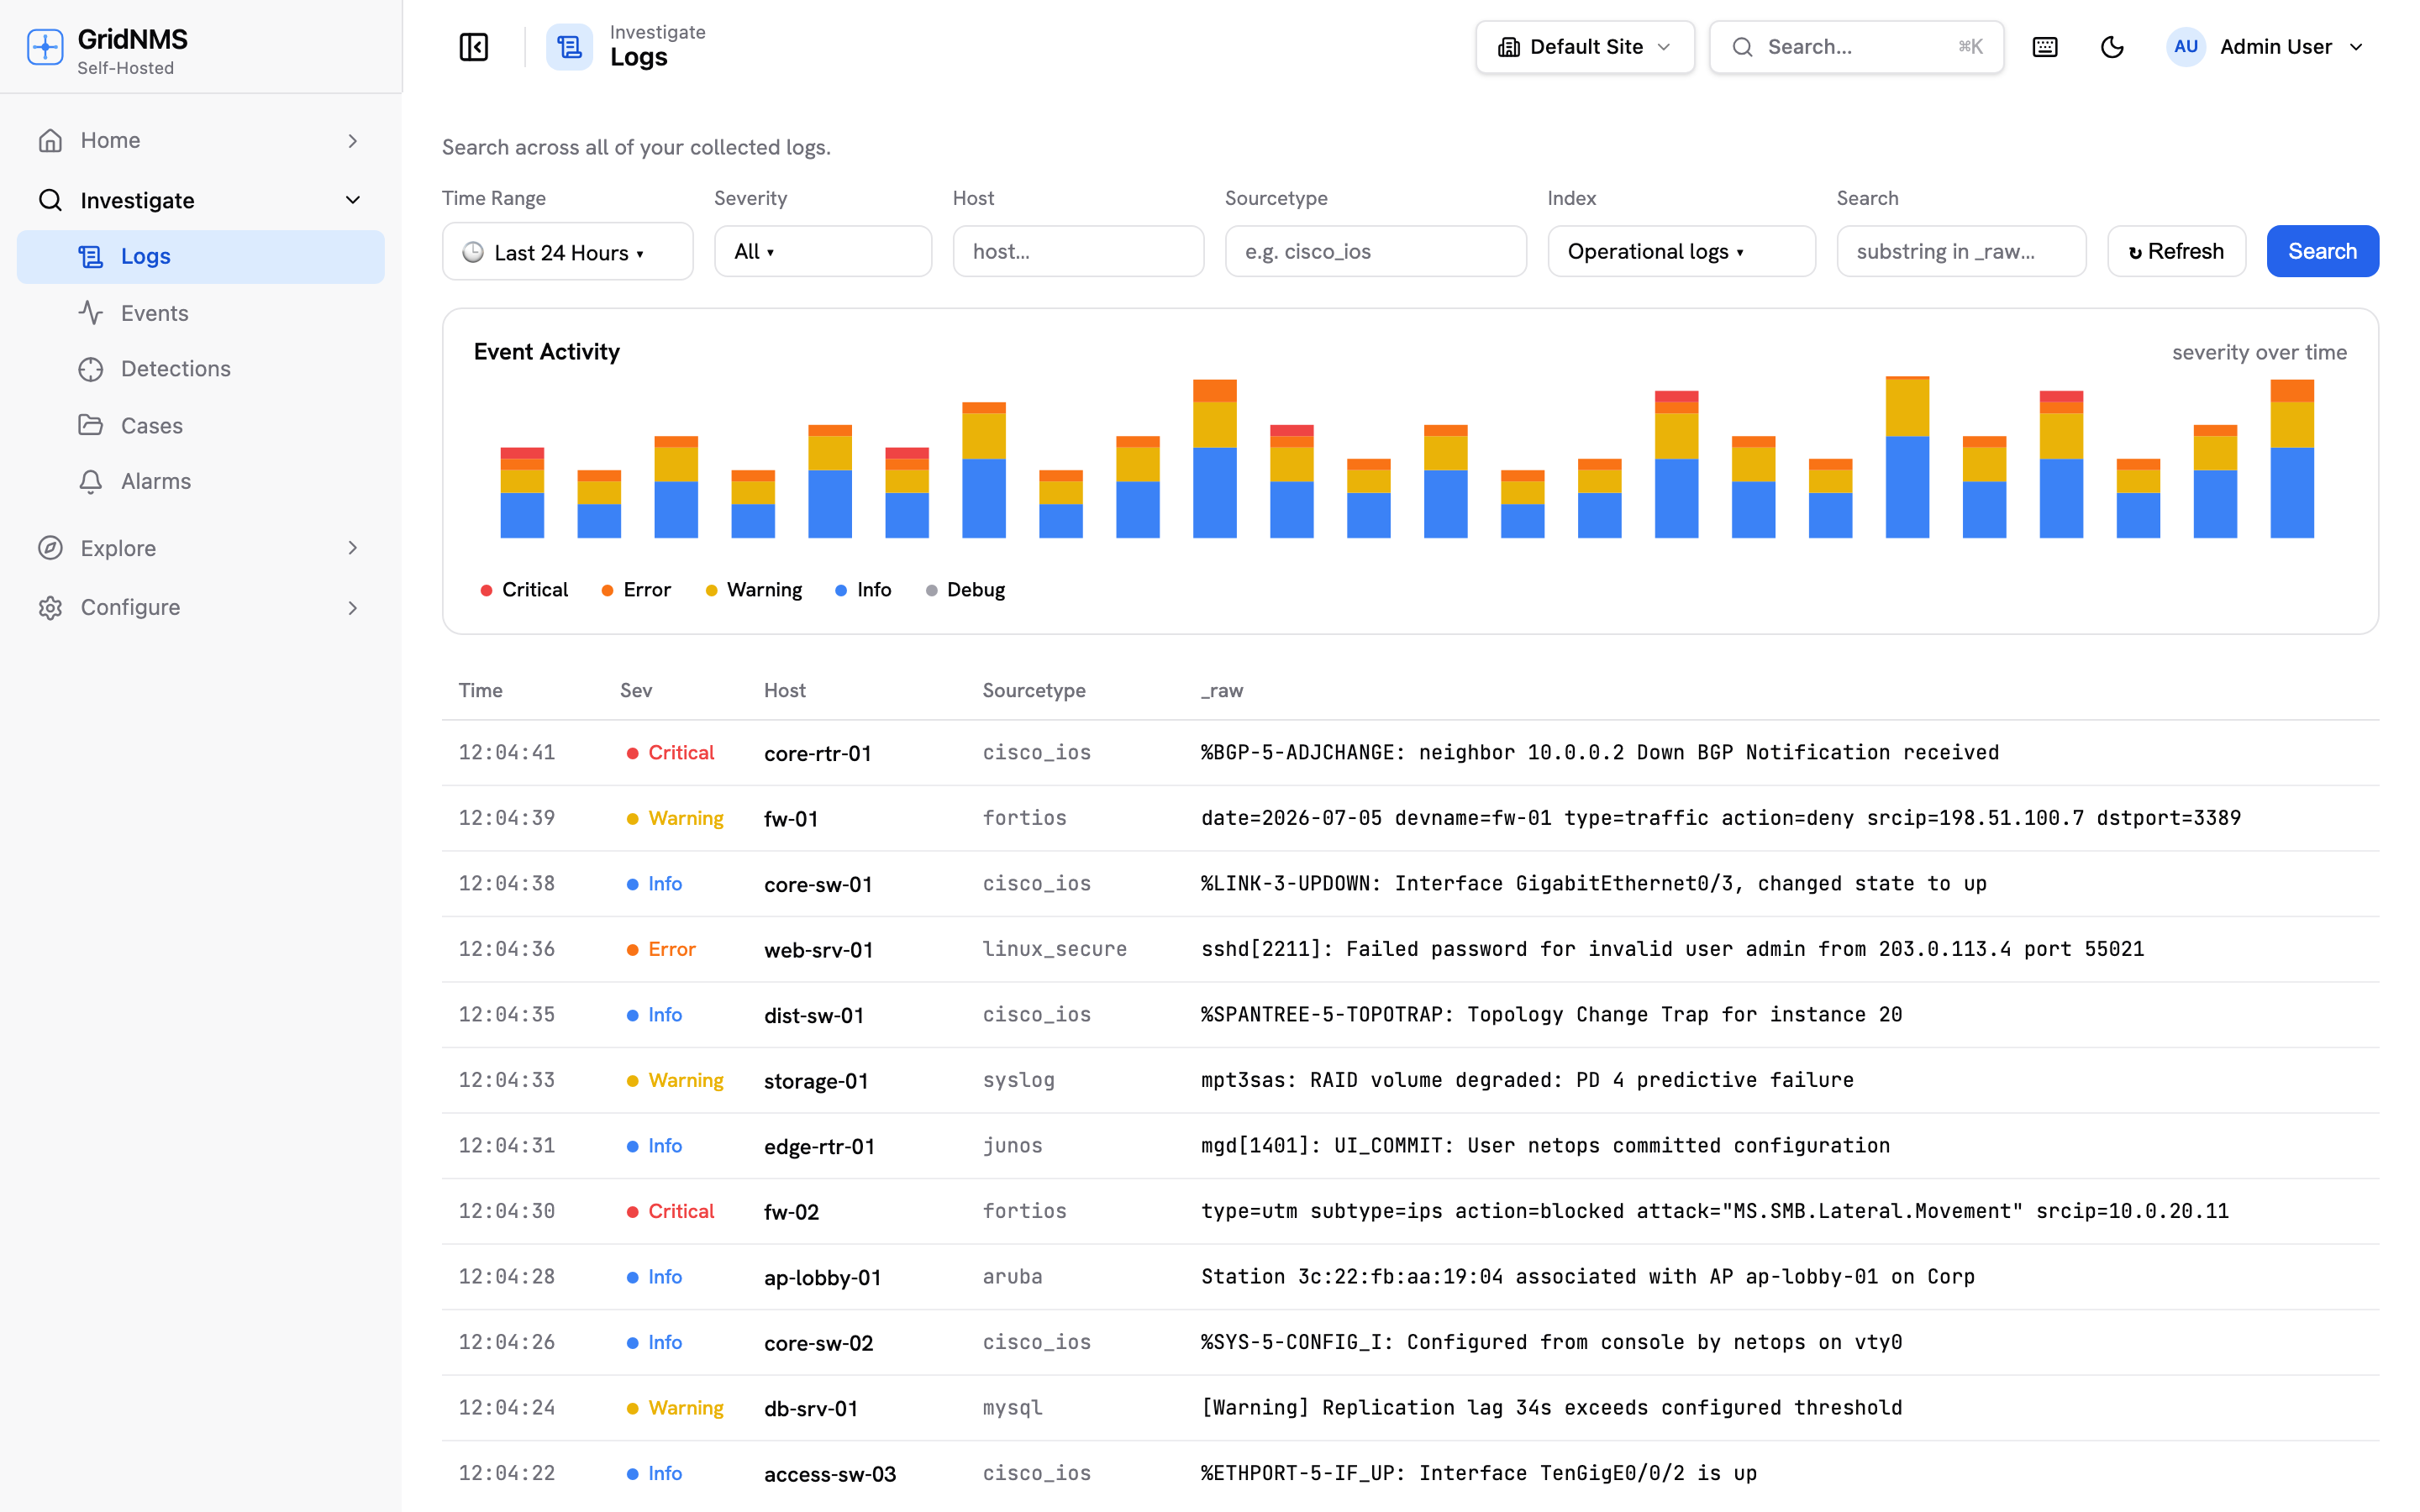
Search every log, structured and fast.
Syslog and traps land in one searchable store, with fields extracted from raw lines so you can filter by device, severity, or any parsed value. A full year of history stays queryable, with a cheaper cold tier beyond it.
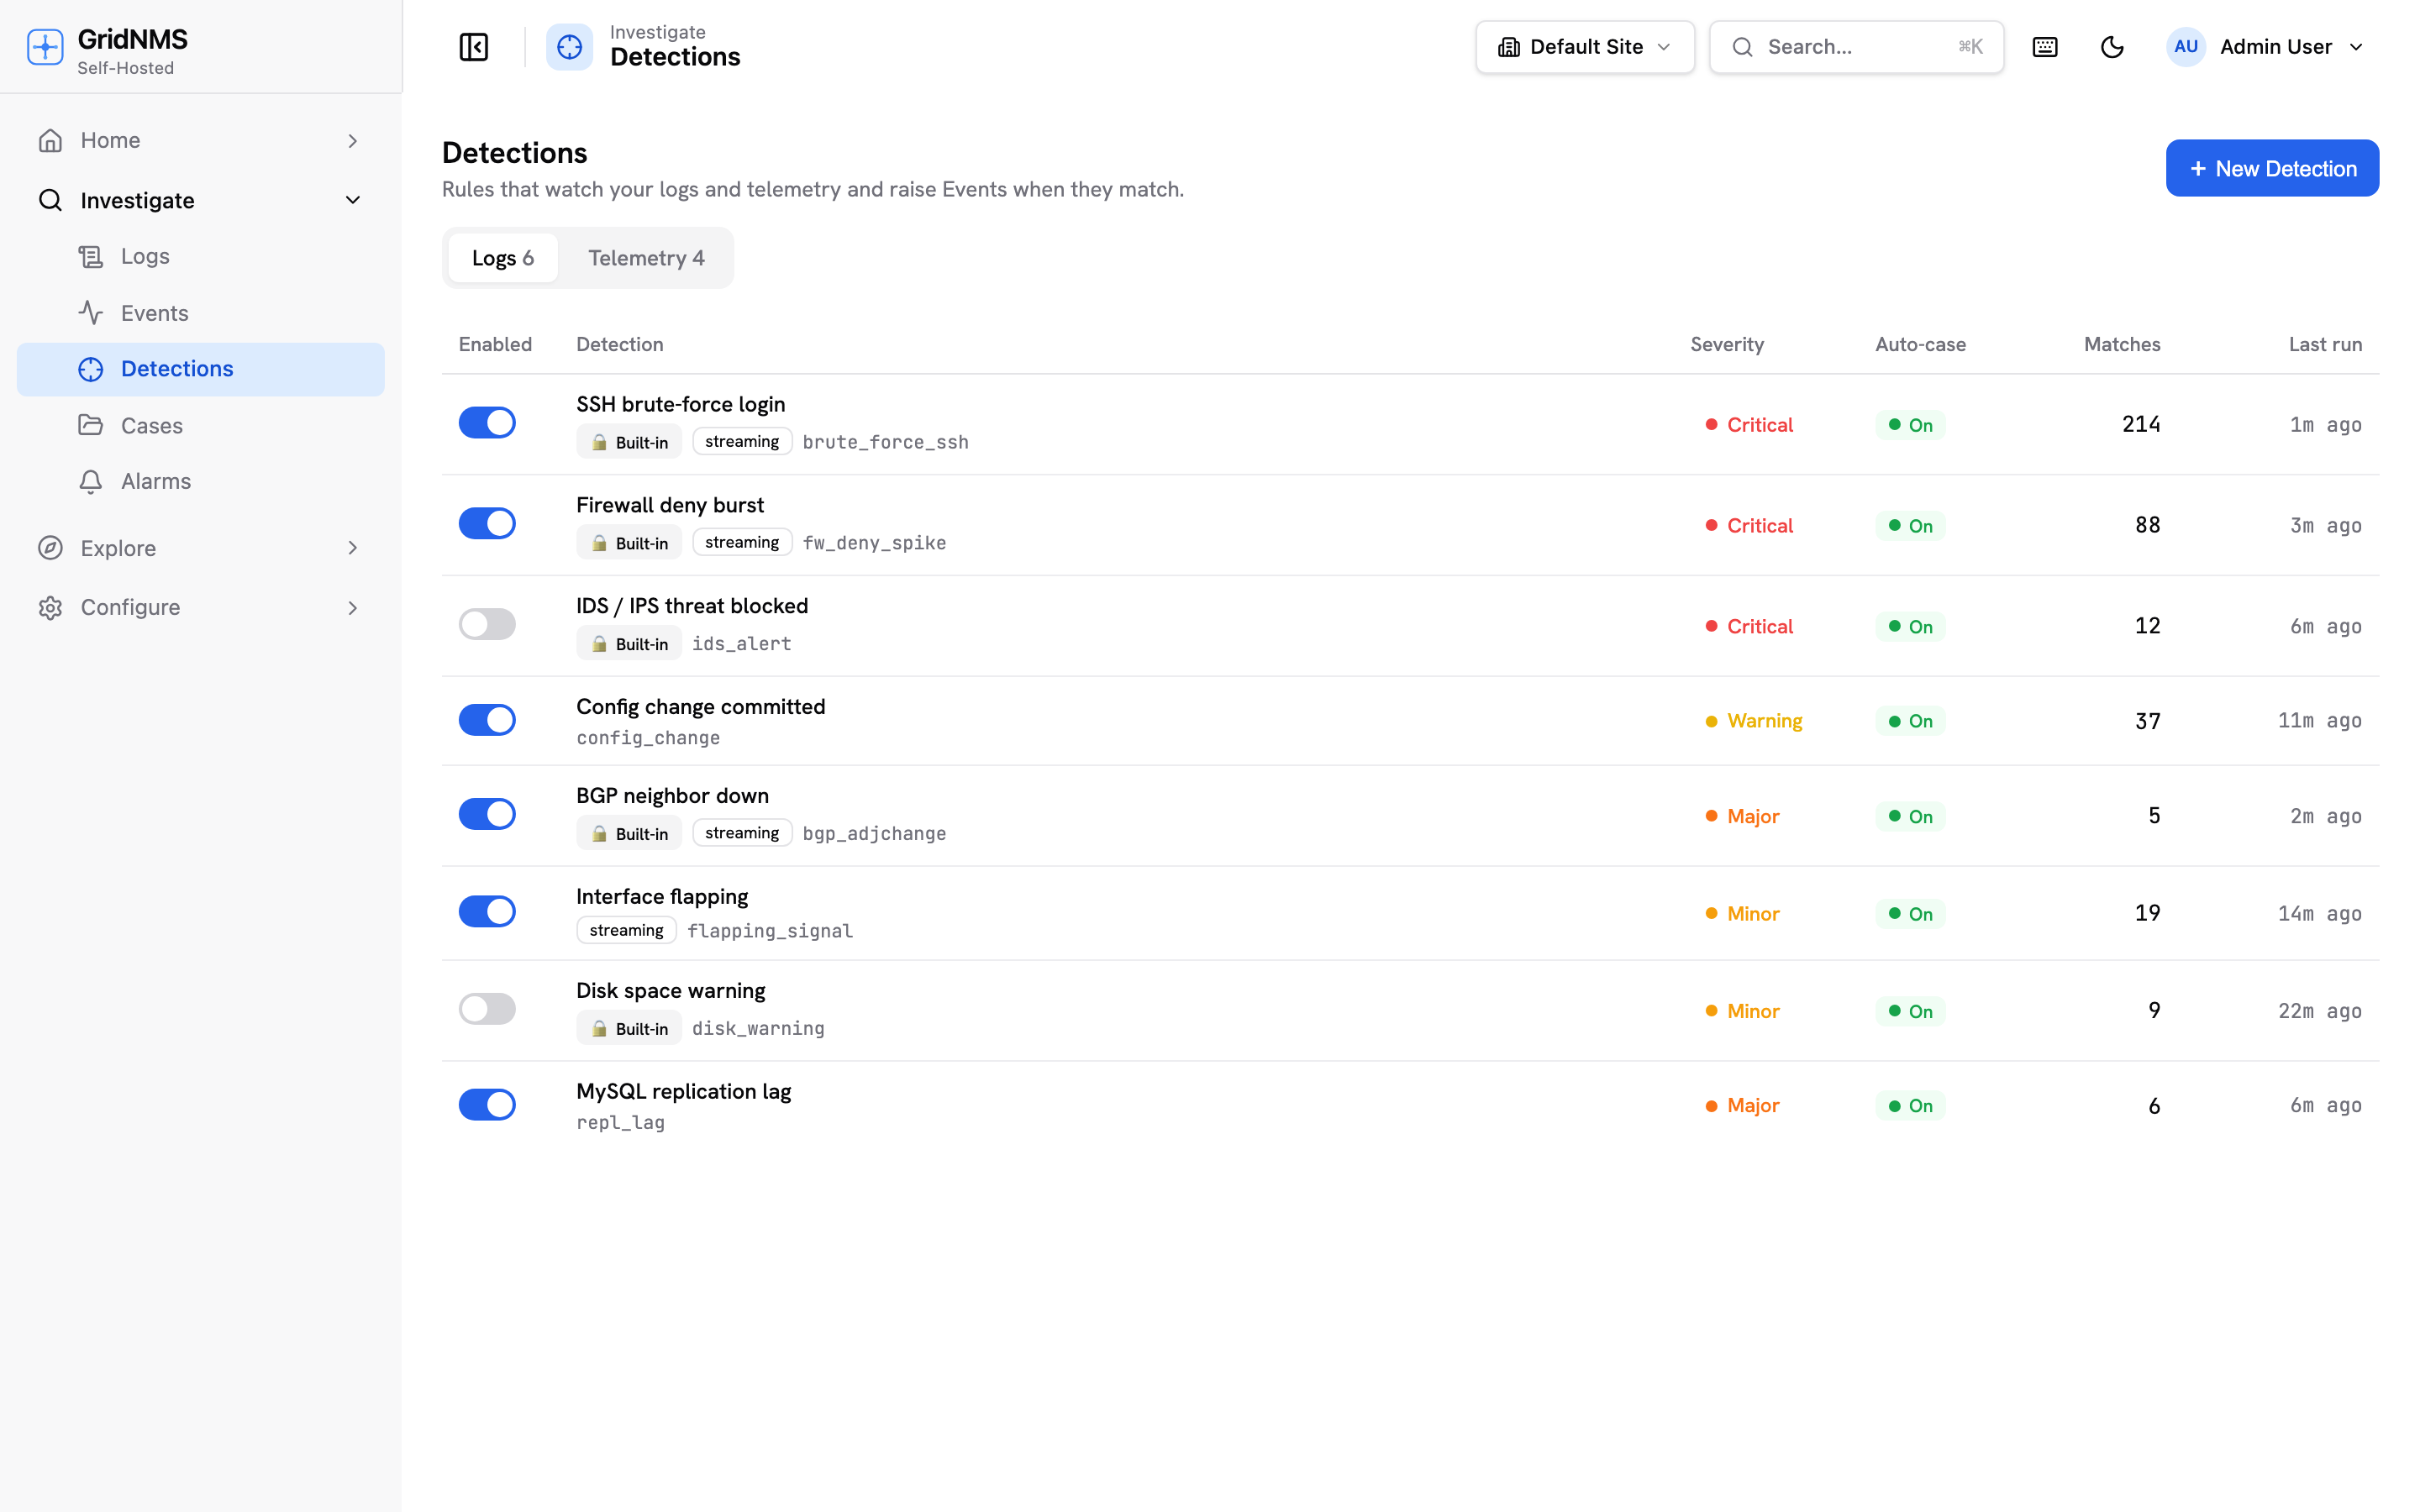
Turn signal into a prioritized event.
Detections are written once in YARA-L and run across both logs and metrics — scheduled for coverage or streaming at ingest. Each hit becomes an immutable event with a clear severity, ready for correlation and alerting.
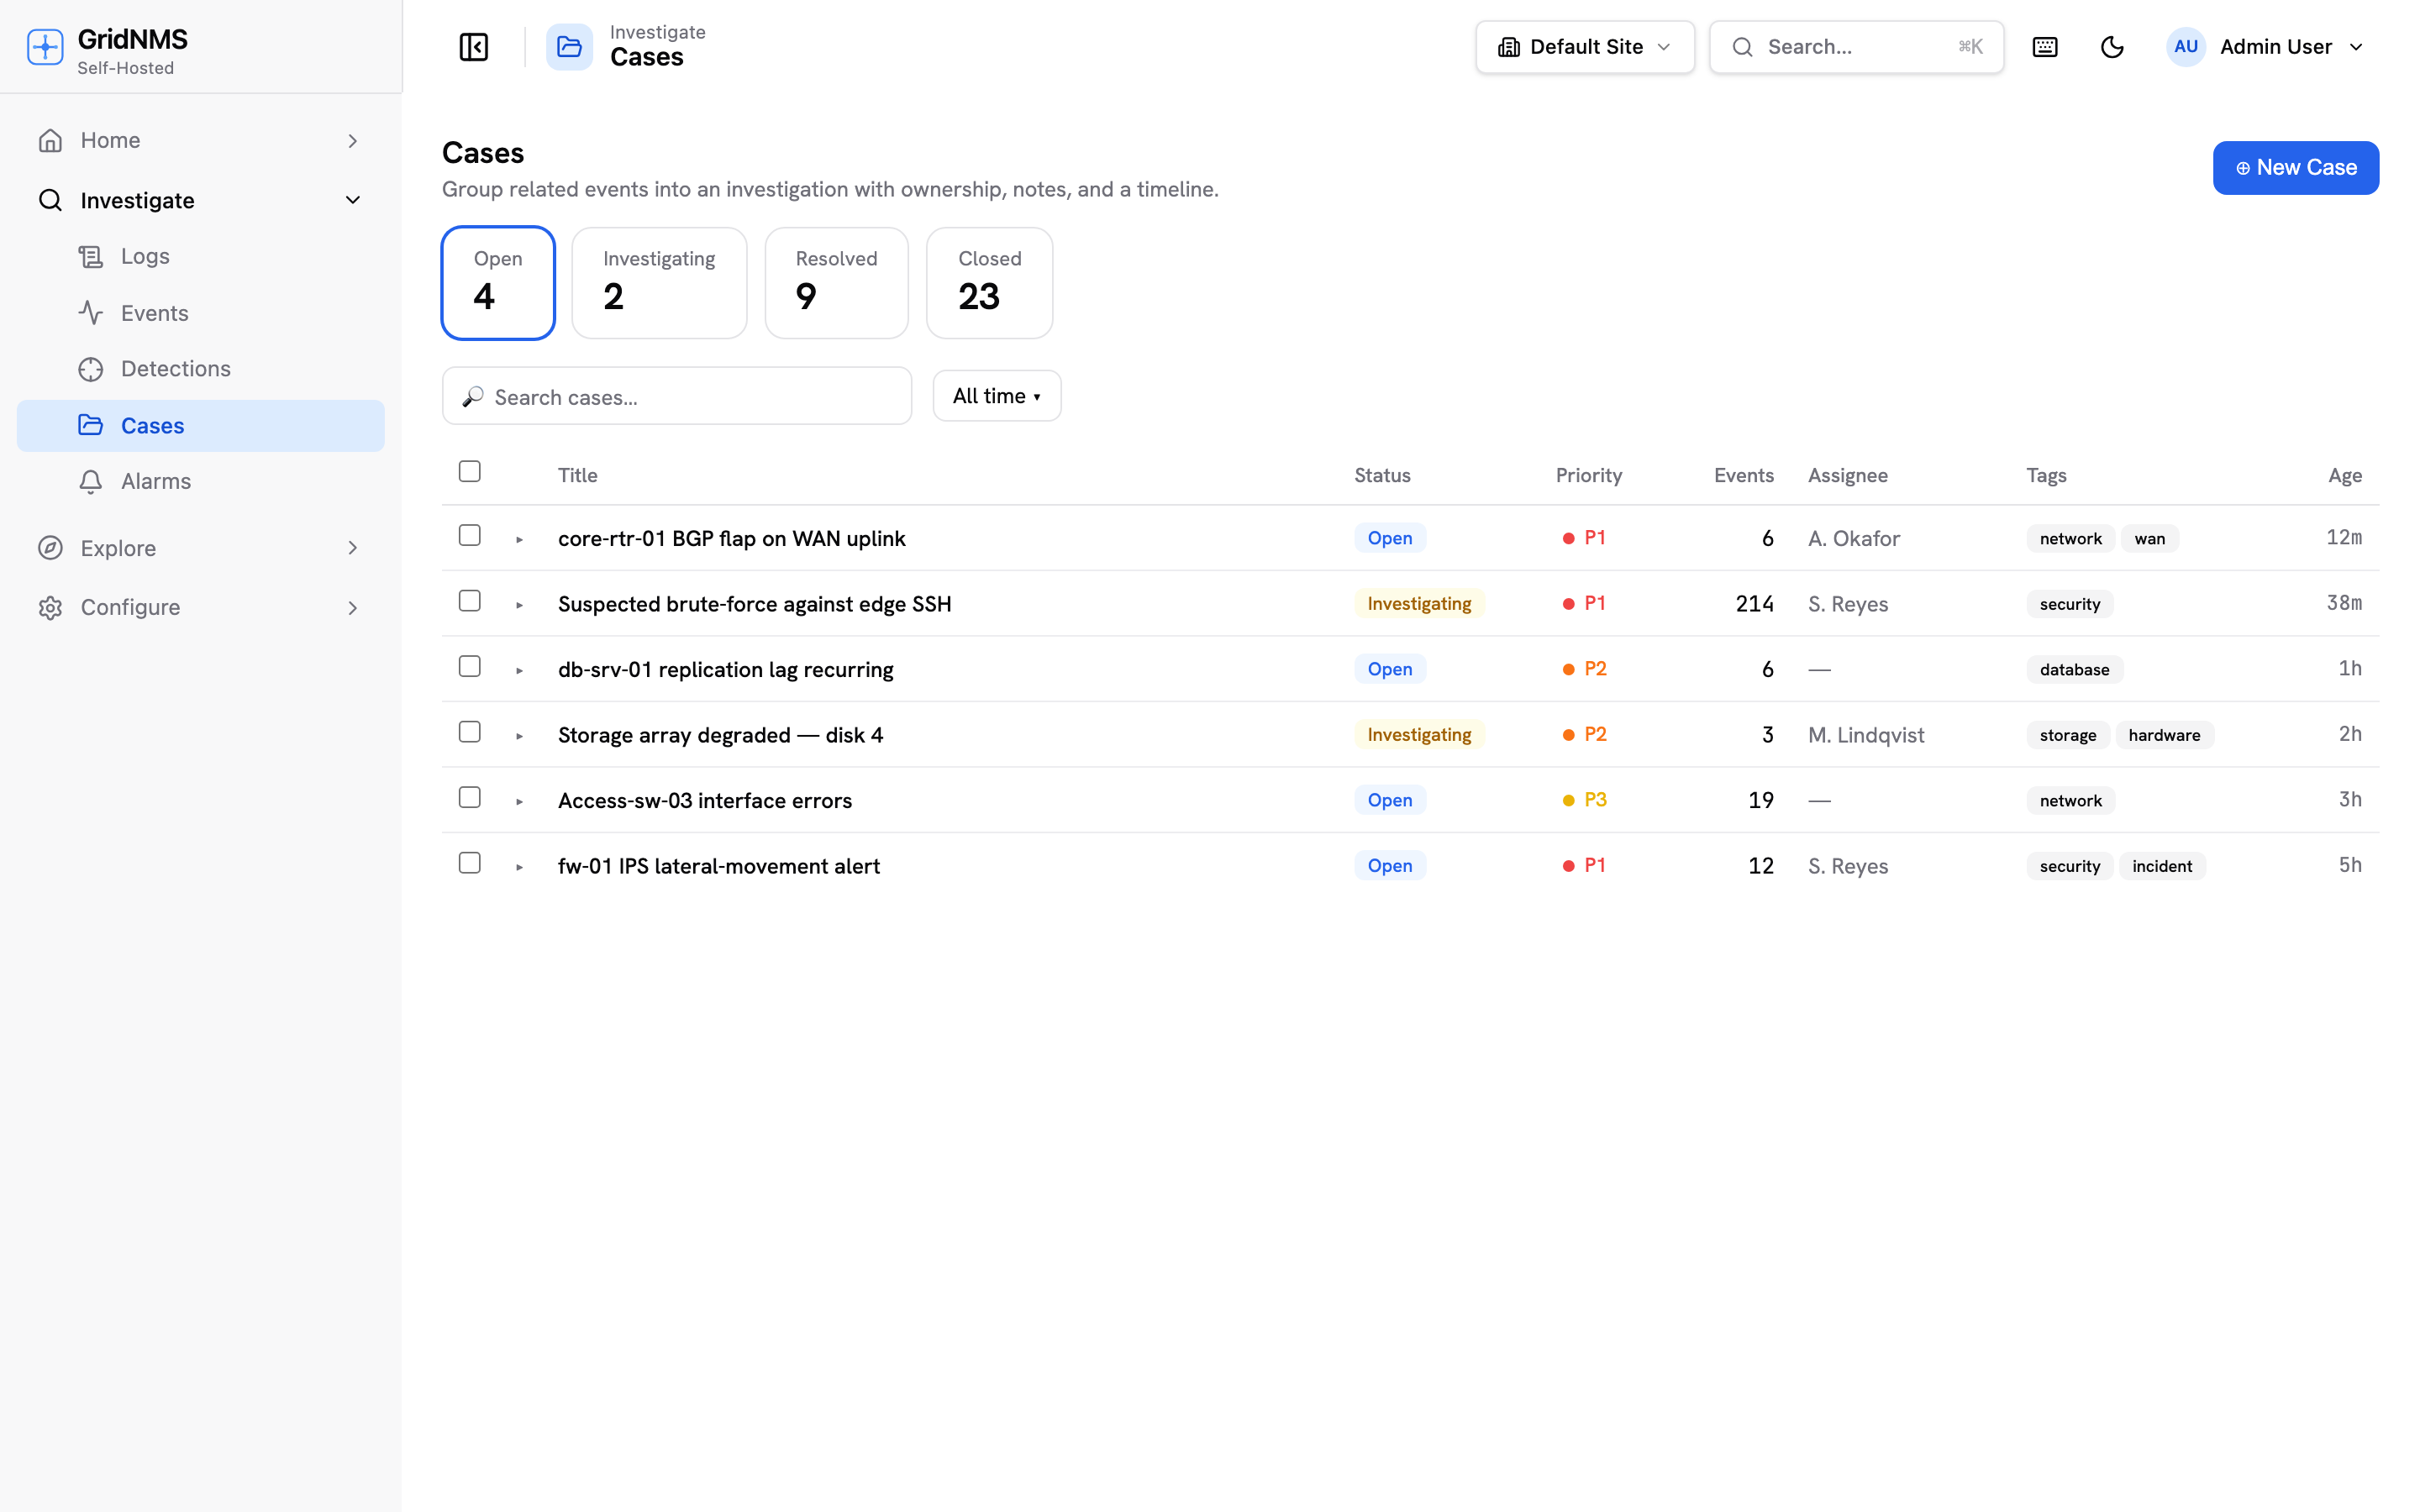
Let the noise group itself into one case.
Case rules correlate related and flapping events into a single case over a window you define, so a storm becomes one alert with full context. Cases are the workbench where you investigate and resolve — and they close on their own once things go quiet.
Ready to run it on your own network?
From $99/month. Cloud-hosted, or self-hosted with Docker.